Truth is the basis of progress. With decisions, strategy,plans, and performance, turning from bad to better requires facing reality and connecting dots between cause and effect, answering: where are we and more importantly, how did we get here? It requires digging deep into the explanation for current state and considering multiple potential root causes of positive and negative results. Sure, sometimes we get lucky and a gut feeling guides us in the right direction. But a heaping dose of reality can expand the possibility of success when it comes to our business.
Here is an example, of which you may be able to relate. Annual planning time comes around and the main factor in creating next year’s plan is past financial results. The default is to lean on financial history and our experience to inform choices, but this approach can be incomplete. It misses nuances and the causality between current performance and previous choices. For example, the ripple effect that a cut in our R&D budget can have on customer dissatisfaction from a lack of new product innovation, or a cut to the sales training budget can have on customer performance.
Leaders must give themselves the best chance of anticipating and delivering desired future results with a thorough assessment before embarking on any major initiative. Remember, truth is the basis of progress.
We constantly push clients to give proper weight to the assessment process. A good assessment builds grit, toughness and honesty – it strengthens our truth muscle. The stronger we build our ability to be honest about past performance, the more realistic we can be about future plans. All businesses have limits, and those limits are reflected in our history, our customers (current and potential) and the industry in which we operate.
Knowing our limits helps us paint a probable future instead of one that is aspirational.
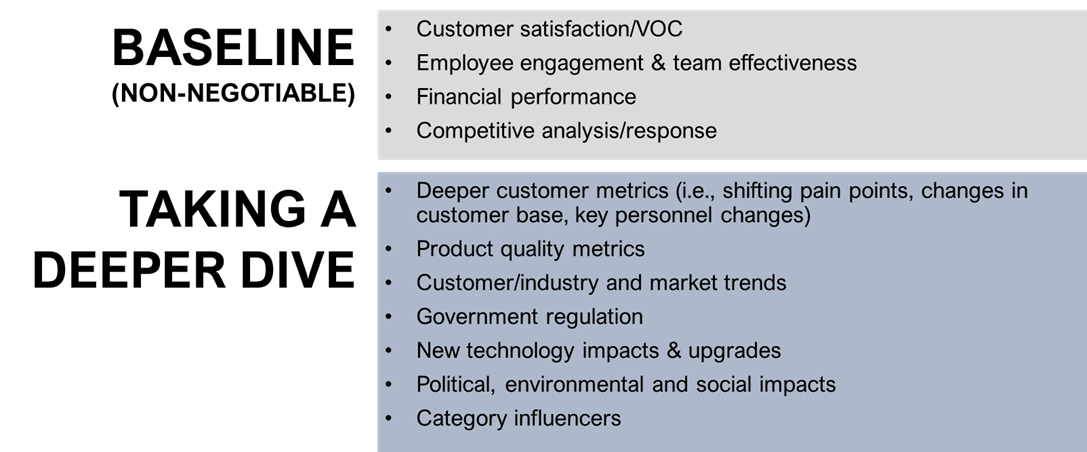
There is a direct correlation between gravity and the importance of the plan or decision in comparison to the level of assessment. Consider how deep you need to go based on the task at hand. Regardless of the task, we believe there are some non-negotiable, baseline items that must be assessed. Completing this baseline item assessment (vs. looking at financial performance alone) will paint a clearer picture of why performance is what it is and if your goal is feasible.

The baseline assessment includes four components and should be conducted in the sequence provided below. Looking at customer and team metrics first will shine light onto why your financial performance is on target or not.
Customer satisfaction/VOC.
Customers can be internal or external, depending on the goal. Are we delivering things that customers need and meeting expectations? Are we in a position to meet future/unidentified customer needs? If we are not talking to customers, we just don’t know. Direct customer feedback should guide our allocation of resources – people, time, and money. Examples of customer satisfaction metrics are:
- Net promoter score
- Customer service feedback (frequency and subject matter of service calls)
- Customer loyalty and retention and abandonment percentage
Employee engagement & team effectiveness.
There are two important components here: satisfaction working with the company and the capacity to produce work. Do we have the capacity on the team to deliver work at a level that meets (or exceeds) customer expectations and anticipate needs? If so, do our people like working with us and are they likely to stay? Both components are important, and they are connected. If our people love working with us but are falling short of delivering what customers need, we know that changes need to be made. Examples of team metrics are:
- Employee engagement score
- Employee satisfaction survey
- Team effectiveness survey (we recommend Team Renaissance)
- Absenteeism and overtime rates
- Revenue per employee (total revenue/FTE = ballpark estimate of how much revenue an employee brings in)
Financial performance.
At this point in the assessment, you should be able to connect some dots between the factors contributing to past performance. What have we learned about the positive or negative impacts that customers and employees have on the bottom line? Everyone has their preferred standard financial metrics, but here are a few examples:
- Previous year performance (revenue and profit) by product and service line
- Gross and net margin analysis
- New product performance
- A/P and A/R days outstanding
Competitive analysis/response.
Unfortunately, most of us are not Amazon. If we want to compete, we must consider the competitive landscape in which we operate. Our businesses are impacted by choices competitors make related to price, quality, promotions and other factors. Are we winning against the competition? If we are not leading, who is – and why? Examples of competitive analysis are:
- Competitive benchmarking – quality, cost, customers and performance
- Market share and competitive points of difference and points of parity
- Digital metrics – rankings, social media mentions, advertising, etc.
Truth is the basis for progress, but it is tempting to make assumptions about our businesses when planning the next step. The idea is to aggressively challenge the context in which plans are built and decisions are made, by first taking a healthy dose of reality. I challenge you to go deeper, uncover some insights and let them guide you.
Richard Spoon brings more than 25 years of business leadership and consulting experience to ArchPoint. He has led large organization change efforts most of his professional life. For more information on ArchPoint’s comprehensive Organization Performance Model Assessment, contact Richard today.

